
Linking models to time and cost data.
We link BIM models to schedules and cost data to make construction more visible in terms of timing, sequence, quantities and budget.
The aim is more than animating a model or adding costs. It is to evaluate project decisions alongside their time and cost implications.
The difference between 3D, 4D and 5D
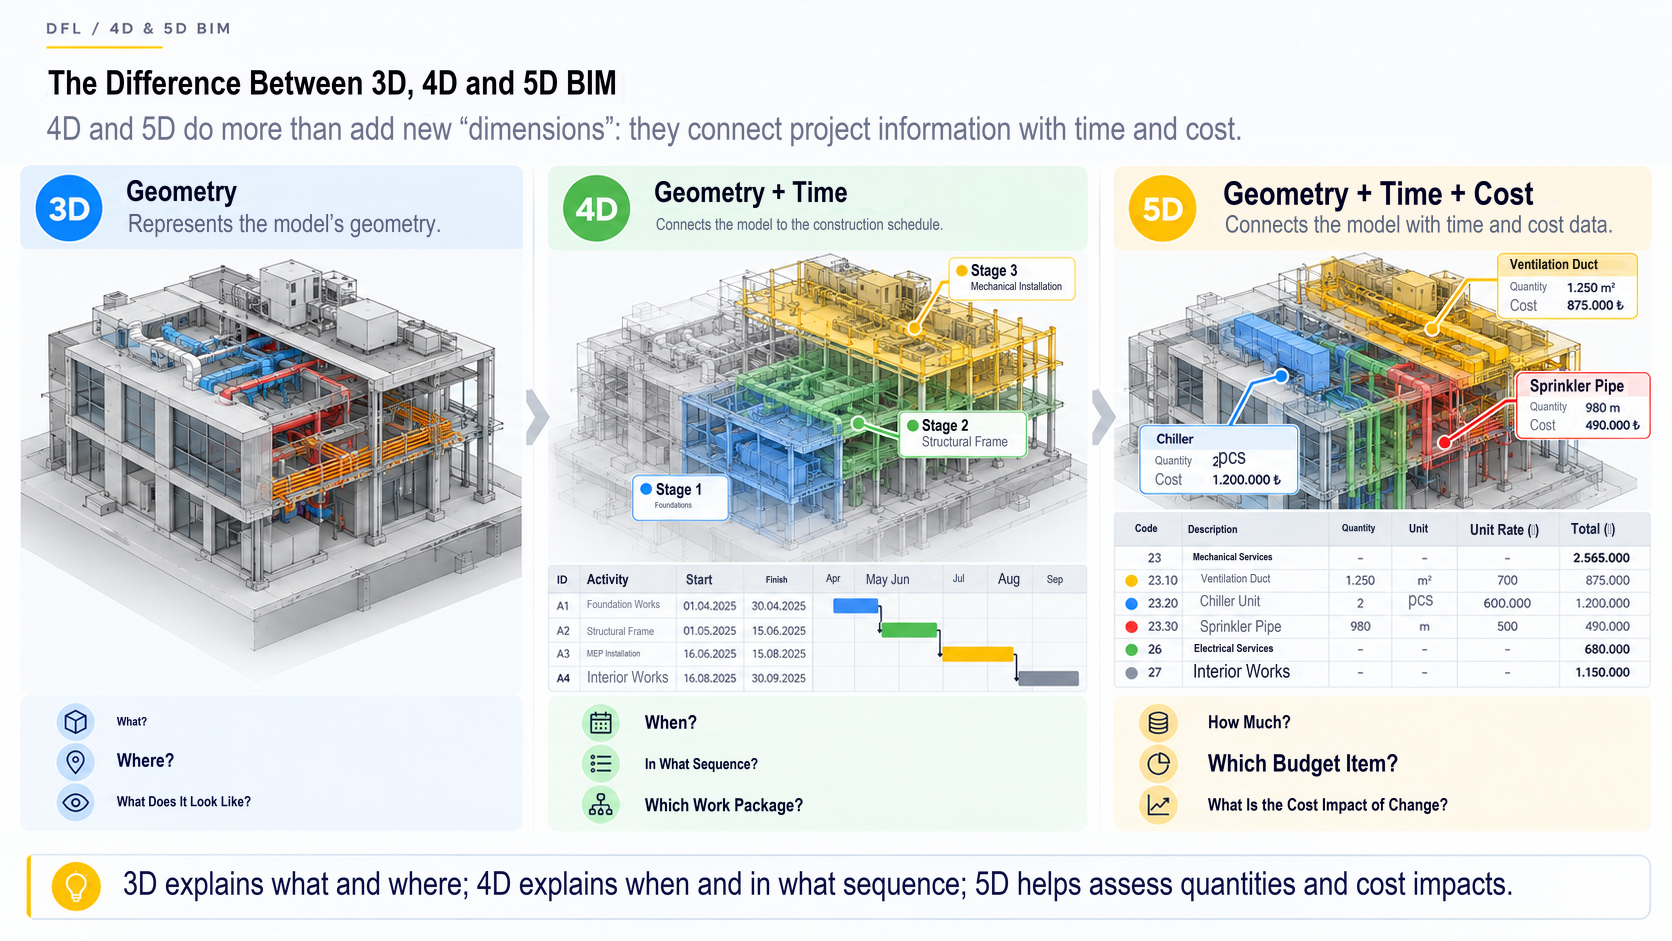
3D — Geometry
- What?
- Where?
- What does it look like?
4D — Geometry + Time
- When?
- In what sequence?
- In which work package?
5D — Geometry + Time + Cost
- How much?
- Under which budget item?
- What is the cost impact of a change?
All numerical values in the diagrams are illustrative teaching examples, not actual project metrics or DFL reference data.
Linking the model to the schedule makes construction visible.
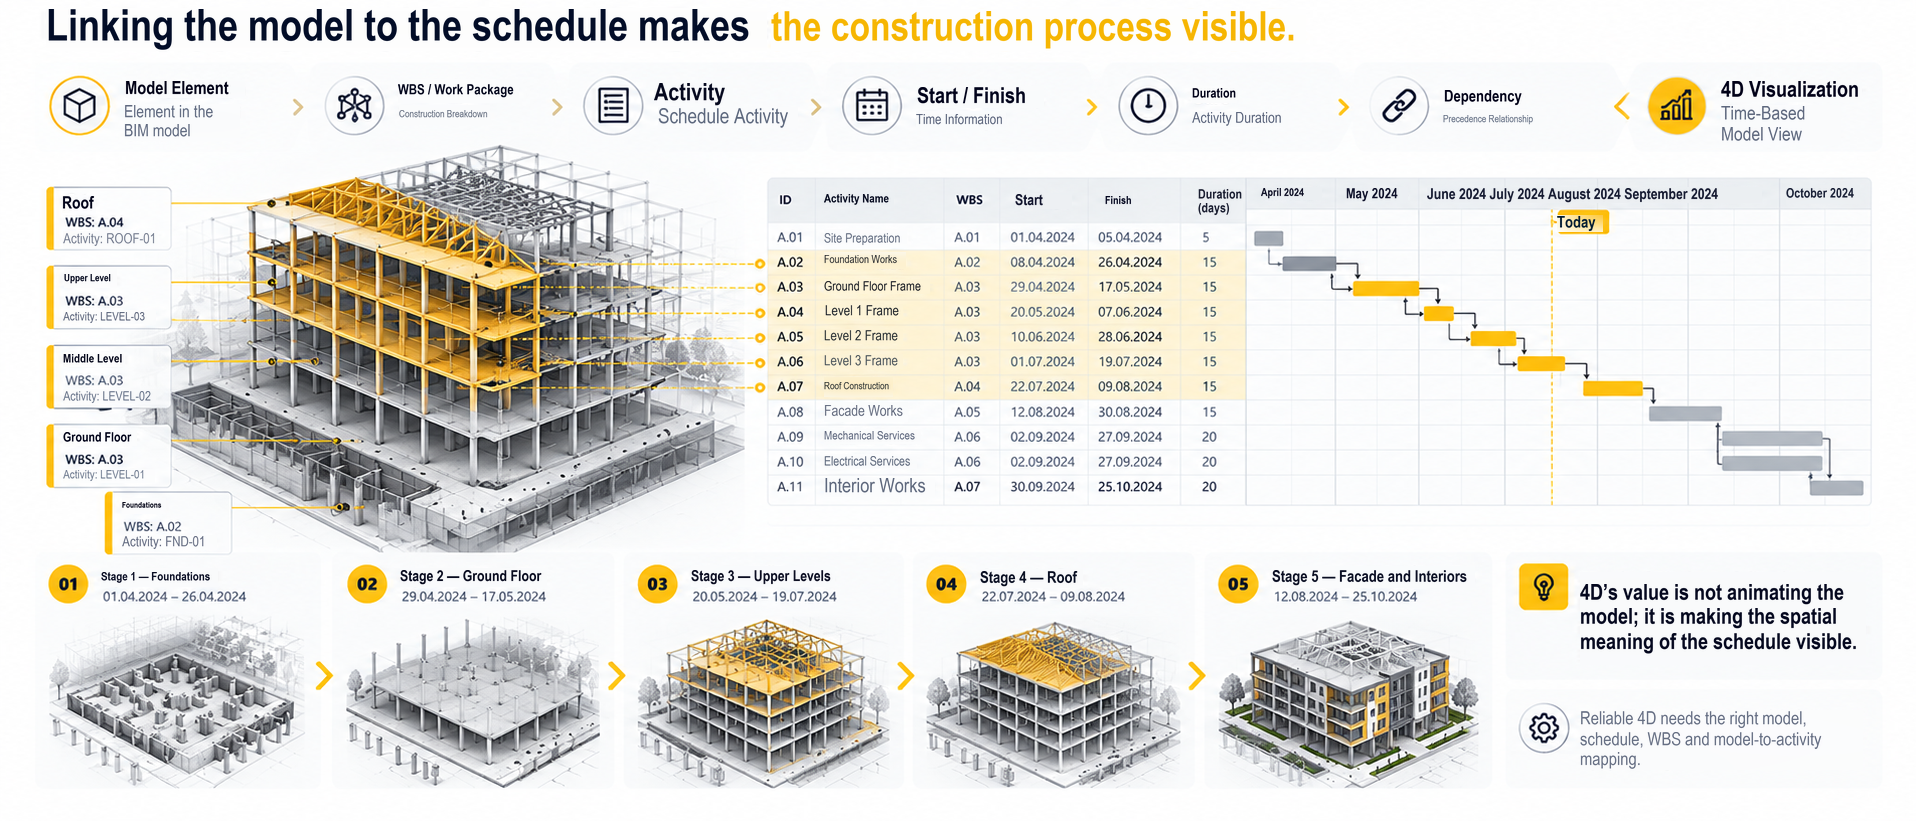
- 01Model Element
- 02WBS / Work Package
- 03Activity
- 04Start / Finish
- 05Duration
- 06Dependency
- 074D Visualization
Reliable 4D requires an appropriate model, schedule, WBS and model-to-activity mapping.
4D use cases
- Construction sequence review
- Phasing
- Work packages
- Logistics
- Site layout
- Temporary works
- Access / working areas
- Visual review of critical work
- Coordination meetings
- Progress assessment
A 4D model does not make these decisions automatically. It provides visual decision support for planning and review.
An attractive animation does not mean effective 4D planning.
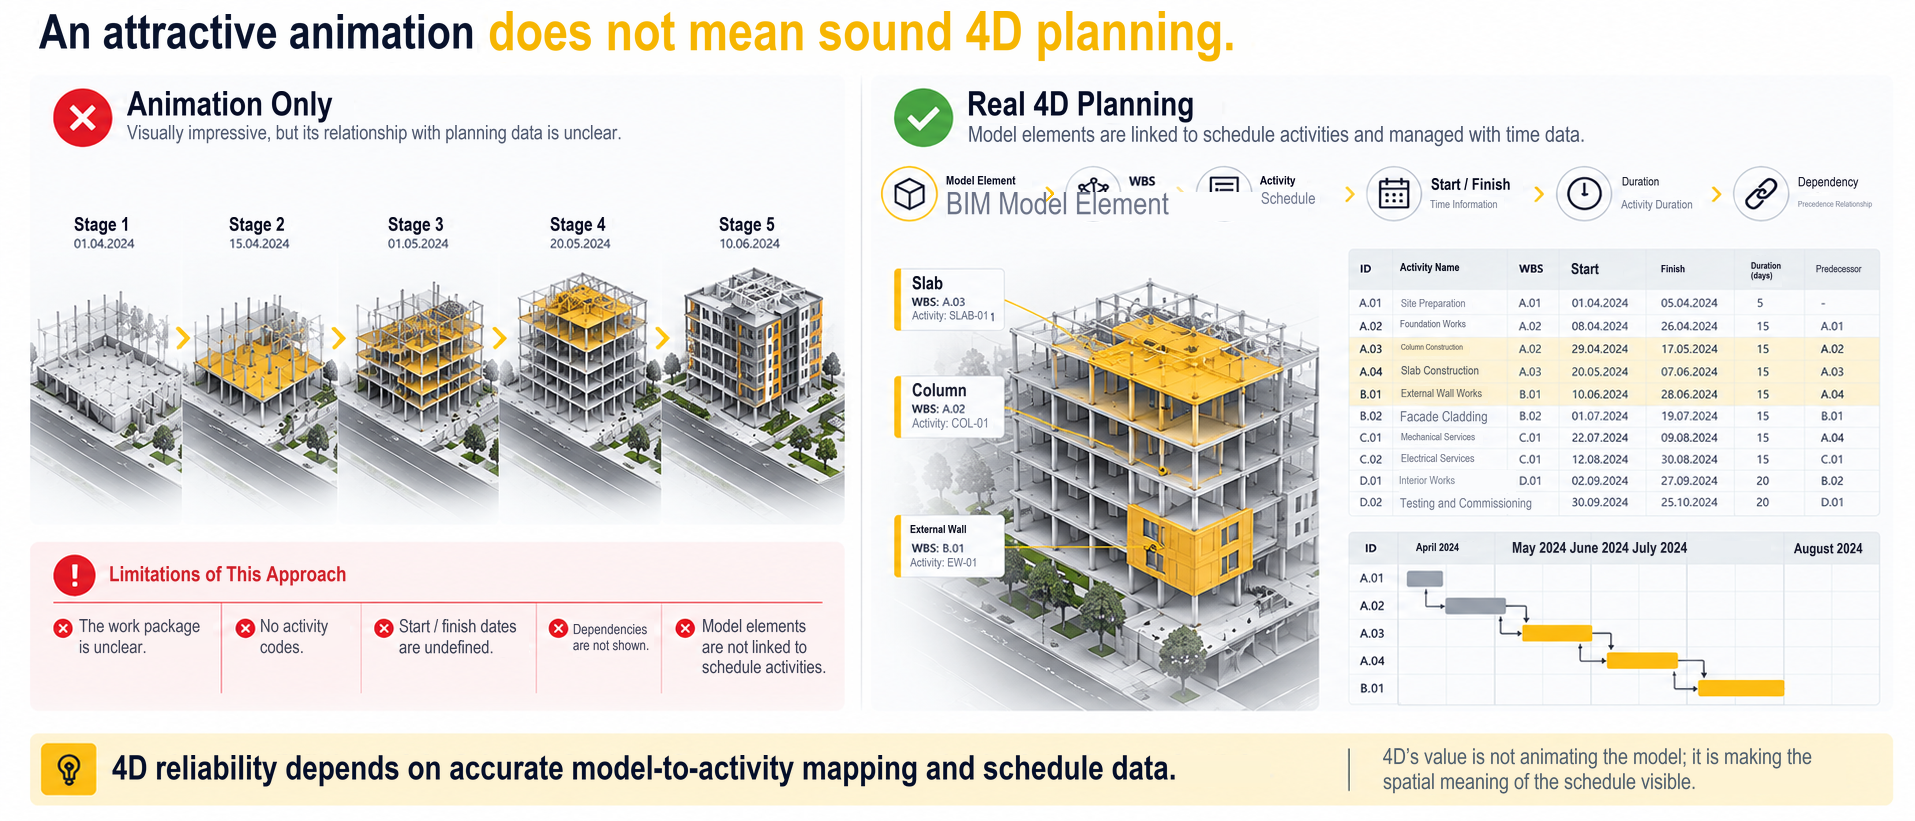
What real 4D requires
- WBS
- Activity codes
- Start / finish
- Duration
- Predecessors / successors
- Phases
- Current schedule
- Correct model-to-activity mapping
5D BIM is more than adding prices to a model.
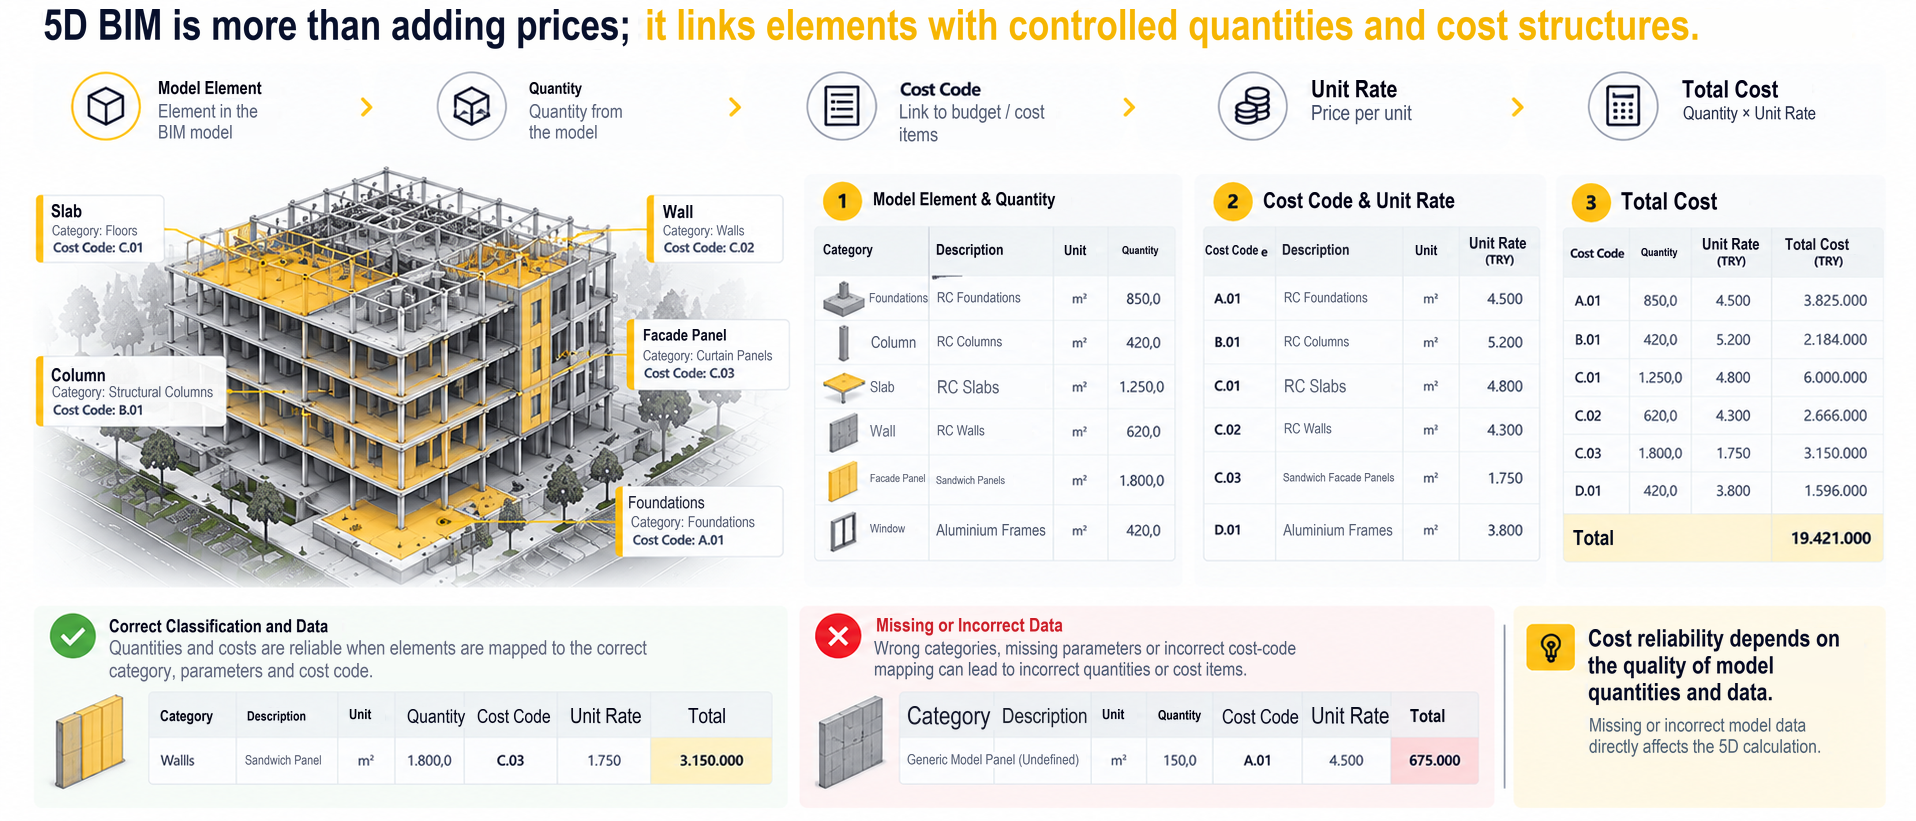
- 01Model Element
- 02Quantity
- 03Cost Code
- 04Unit Rate
- 05Total Cost
Reliable cost calculations depend on the quality of quantities and data in the model.
Cost calculations are only as reliable as the model quantities.
- Category
- Geometry
- Parameters
- Classification
- Quantity rules
- Cost codes
- Units
- Price source
- Price date
Model changes can affect time and cost decisions together.
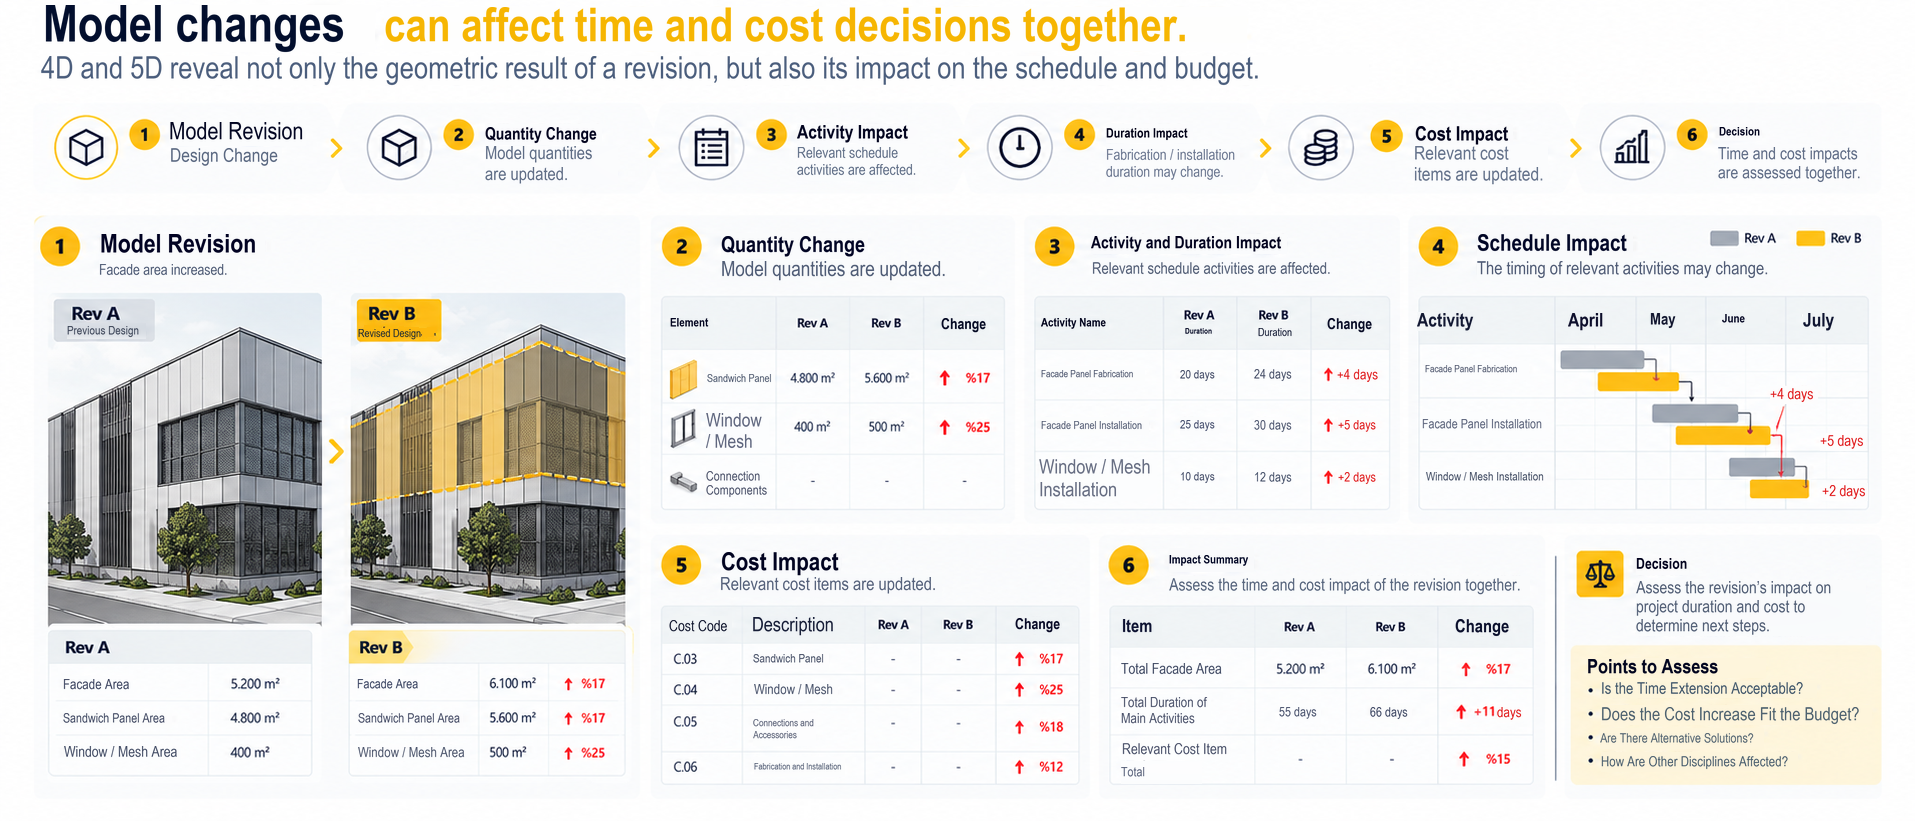
All numerical values in the diagrams are illustrative teaching examples, not actual project metrics or DFL reference data.
- 01Model Revision
- 02Quantity Change
- 03Activity Impact
- 04Duration Impact
- 05Cost Impact
- 06Decision
The 4D / 5D technical workflow
- 01Review the model scope
- 02Establish WBS / cost structure
- 03Map model elements
- 04Link time data
- 05Link cost data
- 06Check / validate
- 07Review scenarios / revisions
- 08Report / support decisions
Compare alternatives rather than a single outcome.
Scenario A
- Duration
- Sequence
- Resources
- Cost
- Site impact
Scenario B
- Duration
- Sequence
- Resources
- Cost
- Site impact
Scenario C
- Duration
- Sequence
- Resources
- Cost
- Site impact
Comparison criteria are shown; no actual project data is included.
Planned and actual progress can be compared.
When current site or project data is available, planned and actual conditions can be compared through the model.
Deliverables defined by project scope
- 4D simulations
- Phasing visuals
- Work package views
- Model–schedule mapping table
- Quantity / cost mapping
- Cost breakdown
- Scenario comparisons
- Revision impact analysis
- Visual reports
Not all these deliverables are required on every project. Scope is defined by project requirements.
Technology and data environments
- Autodesk Revit
- Navisworks
- Autodesk Construction Cloud
- Schedule data from Primavera P6 / MS Project
- Excel / CSV
- IFC / openBIM
- Automation where appropriate
Software and data structures are selected according to project requirements.
Link time and cost data to the model to make decisions more visible.
Let’s assess the model scope, schedule structure, quantities and cost data together.